
Transforming Dispersed Observations into Defensible Predictive Models
Spatial patterns rarely occur by chance. Tobler's First Law of Geography establishes that near things are more related than distant things. GeoPhoenix leverages this fundamental principle through robust Exploratory Spatial Data Analysis (ESDA), identifying statistically significant clusters, spatial outliers, and non-stationarity across your operational data.
We deploy deterministic and geostatistical interpolation (IDW, Empirical Bayesian Kriging, Spline) to convert sparse borehole, soil, or environmental monitoring stations into continuous continuous predictive surfaces. Furthermore, our Multi-Criteria Evaluation (MCE) and Analytic Hierarchy Process (AHP) methodologies combine topographic, environmental, and demographic factors into transparent, weighted suitability models for commercial expansion, renewable energy siting, and conservation priority zoning.
Geostatistical Analytical Suite
- Inverse Distance Weighting (IDW) & Ordinary/Universal Kriging
- Global & Anselin Local Moran's I spatial autocorrelation
- Getis-Ord Gi* hotspot and coldspot z-score analysis
- Geographically Weighted Regression (GWR) & OLS spatial diagnostics
- Isochrone drive-time service areas & network distance matrices
Specialized Spatial Analysis Capabilities
Quantitative spatial modeling configured for environmental, engineering, and commercial decision-making.
IDW & Kriging Interpolation
Continuous surface modeling from point sampling arrays (soil pH, groundwater contaminants, particulate matter PM2.5, elevation) with cross-validation error metrics.
Getis-Ord Gi* Hotspot Analysis
Statistically validated identification of high-value clusters (hotspots) and low-value clusters (coldspots) accounting for spatial distance weights and false discovery rates.
Site Suitability (MCE & AHP)
Weighted linear combination (WLC) and multi-criteria decision models scoring land parcels for solar farms, logistics hubs, or environmental protected sanctuaries.
Network Analysis & Routing
Drive-time isochrones, multi-modal transit catchment areas, closest facility allocation, and vehicle fleet routing utilizing OpenStreetMap and road topology networks.
Spatial Regression (OLS / GWR)
Explaining spatial non-stationarity and spatial lag effects where traditional linear regression fails, revealing how relationships vary across geographic space.
Spatial Clustering & Segmentation
Spatial K-Means, DBSCAN density-based clustering, and demographic territory zoning for corporate market expansion and retail distribution planning.
The Geostatistical Analytical Workflow
From empirical hypothesis testing to cross-validated predictive surfaces.
Exploratory Spatial Data Analysis (ESDA)
Testing for normal distribution, directional anisotropy, spatial outliers, and computing semivariograms to identify spatial correlation range and sill.
Weight Matrix Construction
Defining spatial adjacency matrices (Queen's, Rook's, or Inverse Distance thresholds) reflecting true physical or transport connectivity between spatial units.
Model Execution & Cross-Validation
Executing interpolation or spatial regression algorithms with Leave-One-Out Cross-Validation (LOOCV), checking Root Mean Square Error (RMSE) against null models.
Decision Mapping & Executive Reporting
Translating mathematical matrices into actionable classification tiers, probability maps, and clear technical documentation for non-GIS stakeholders.
Featured Spatial Analysis Deliverables
Examine how our spatial modeling uncovers actionable geographic intelligence.
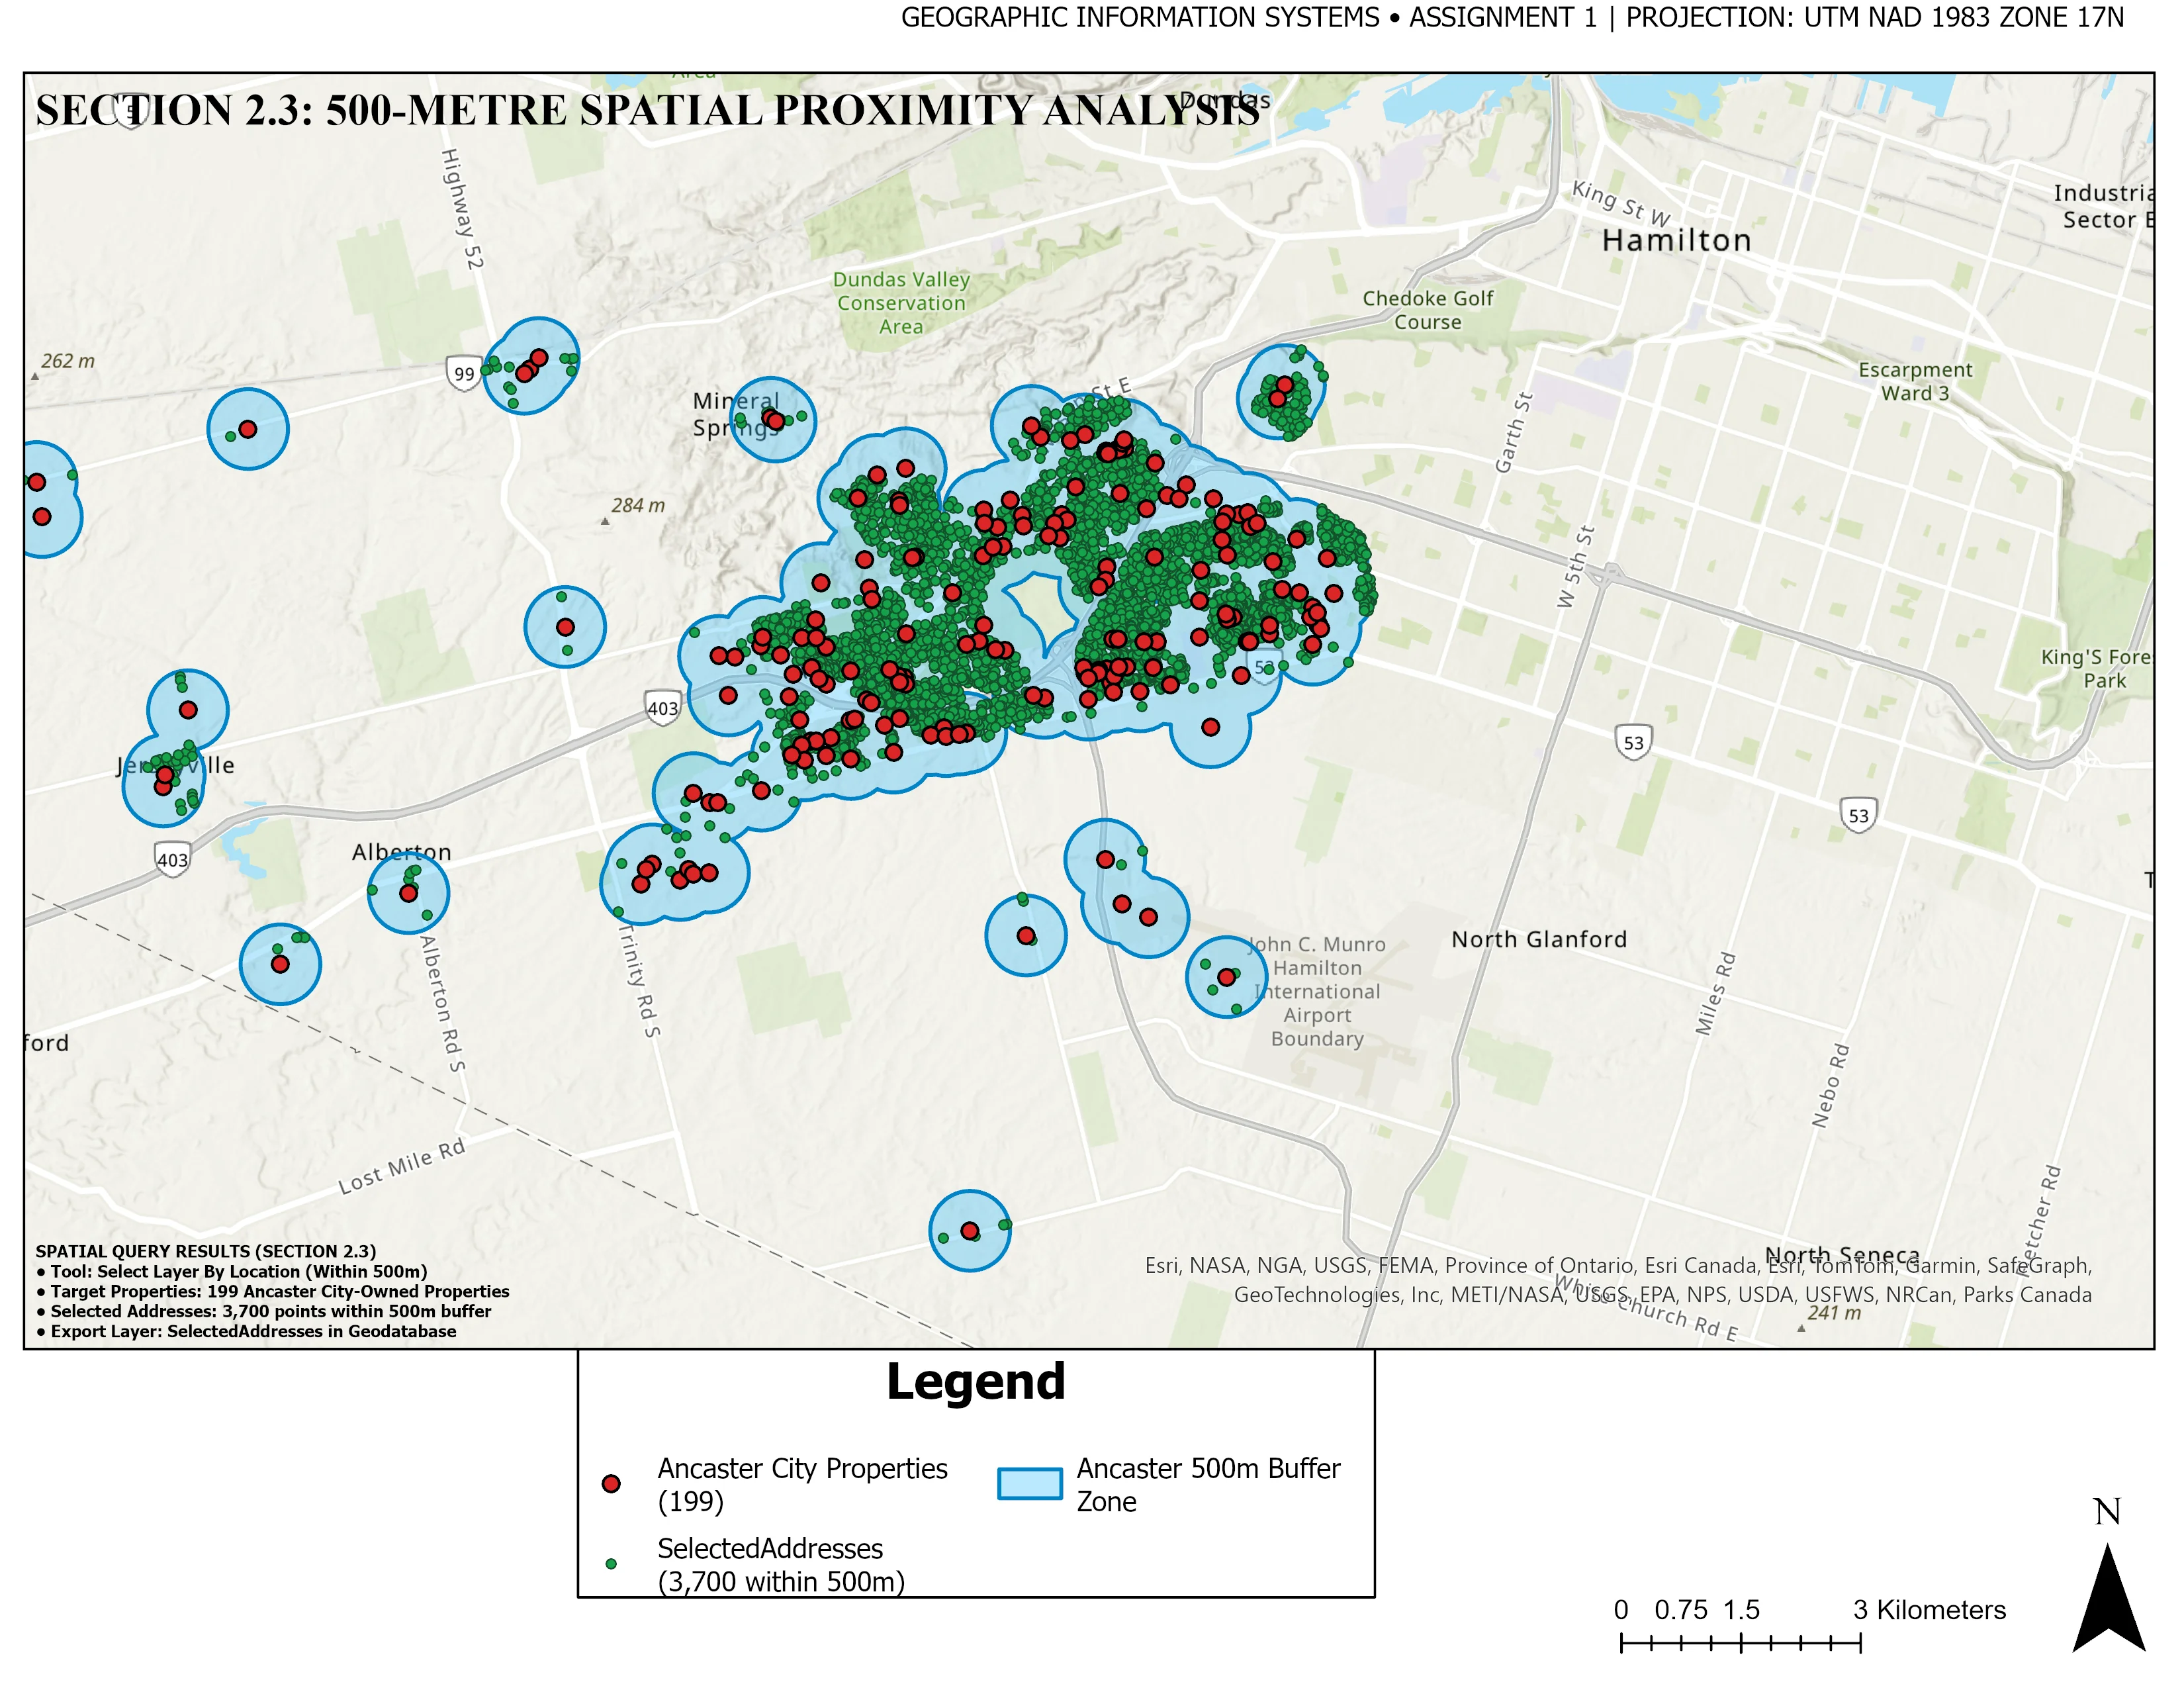
500m Environmental Proximity & Parcel Selection
Multi-layer geometric buffer analysis identifying residential parcel intersections within critical 500-meter conservation corridors, delivering precise property selection matrices and metric overlap verification.
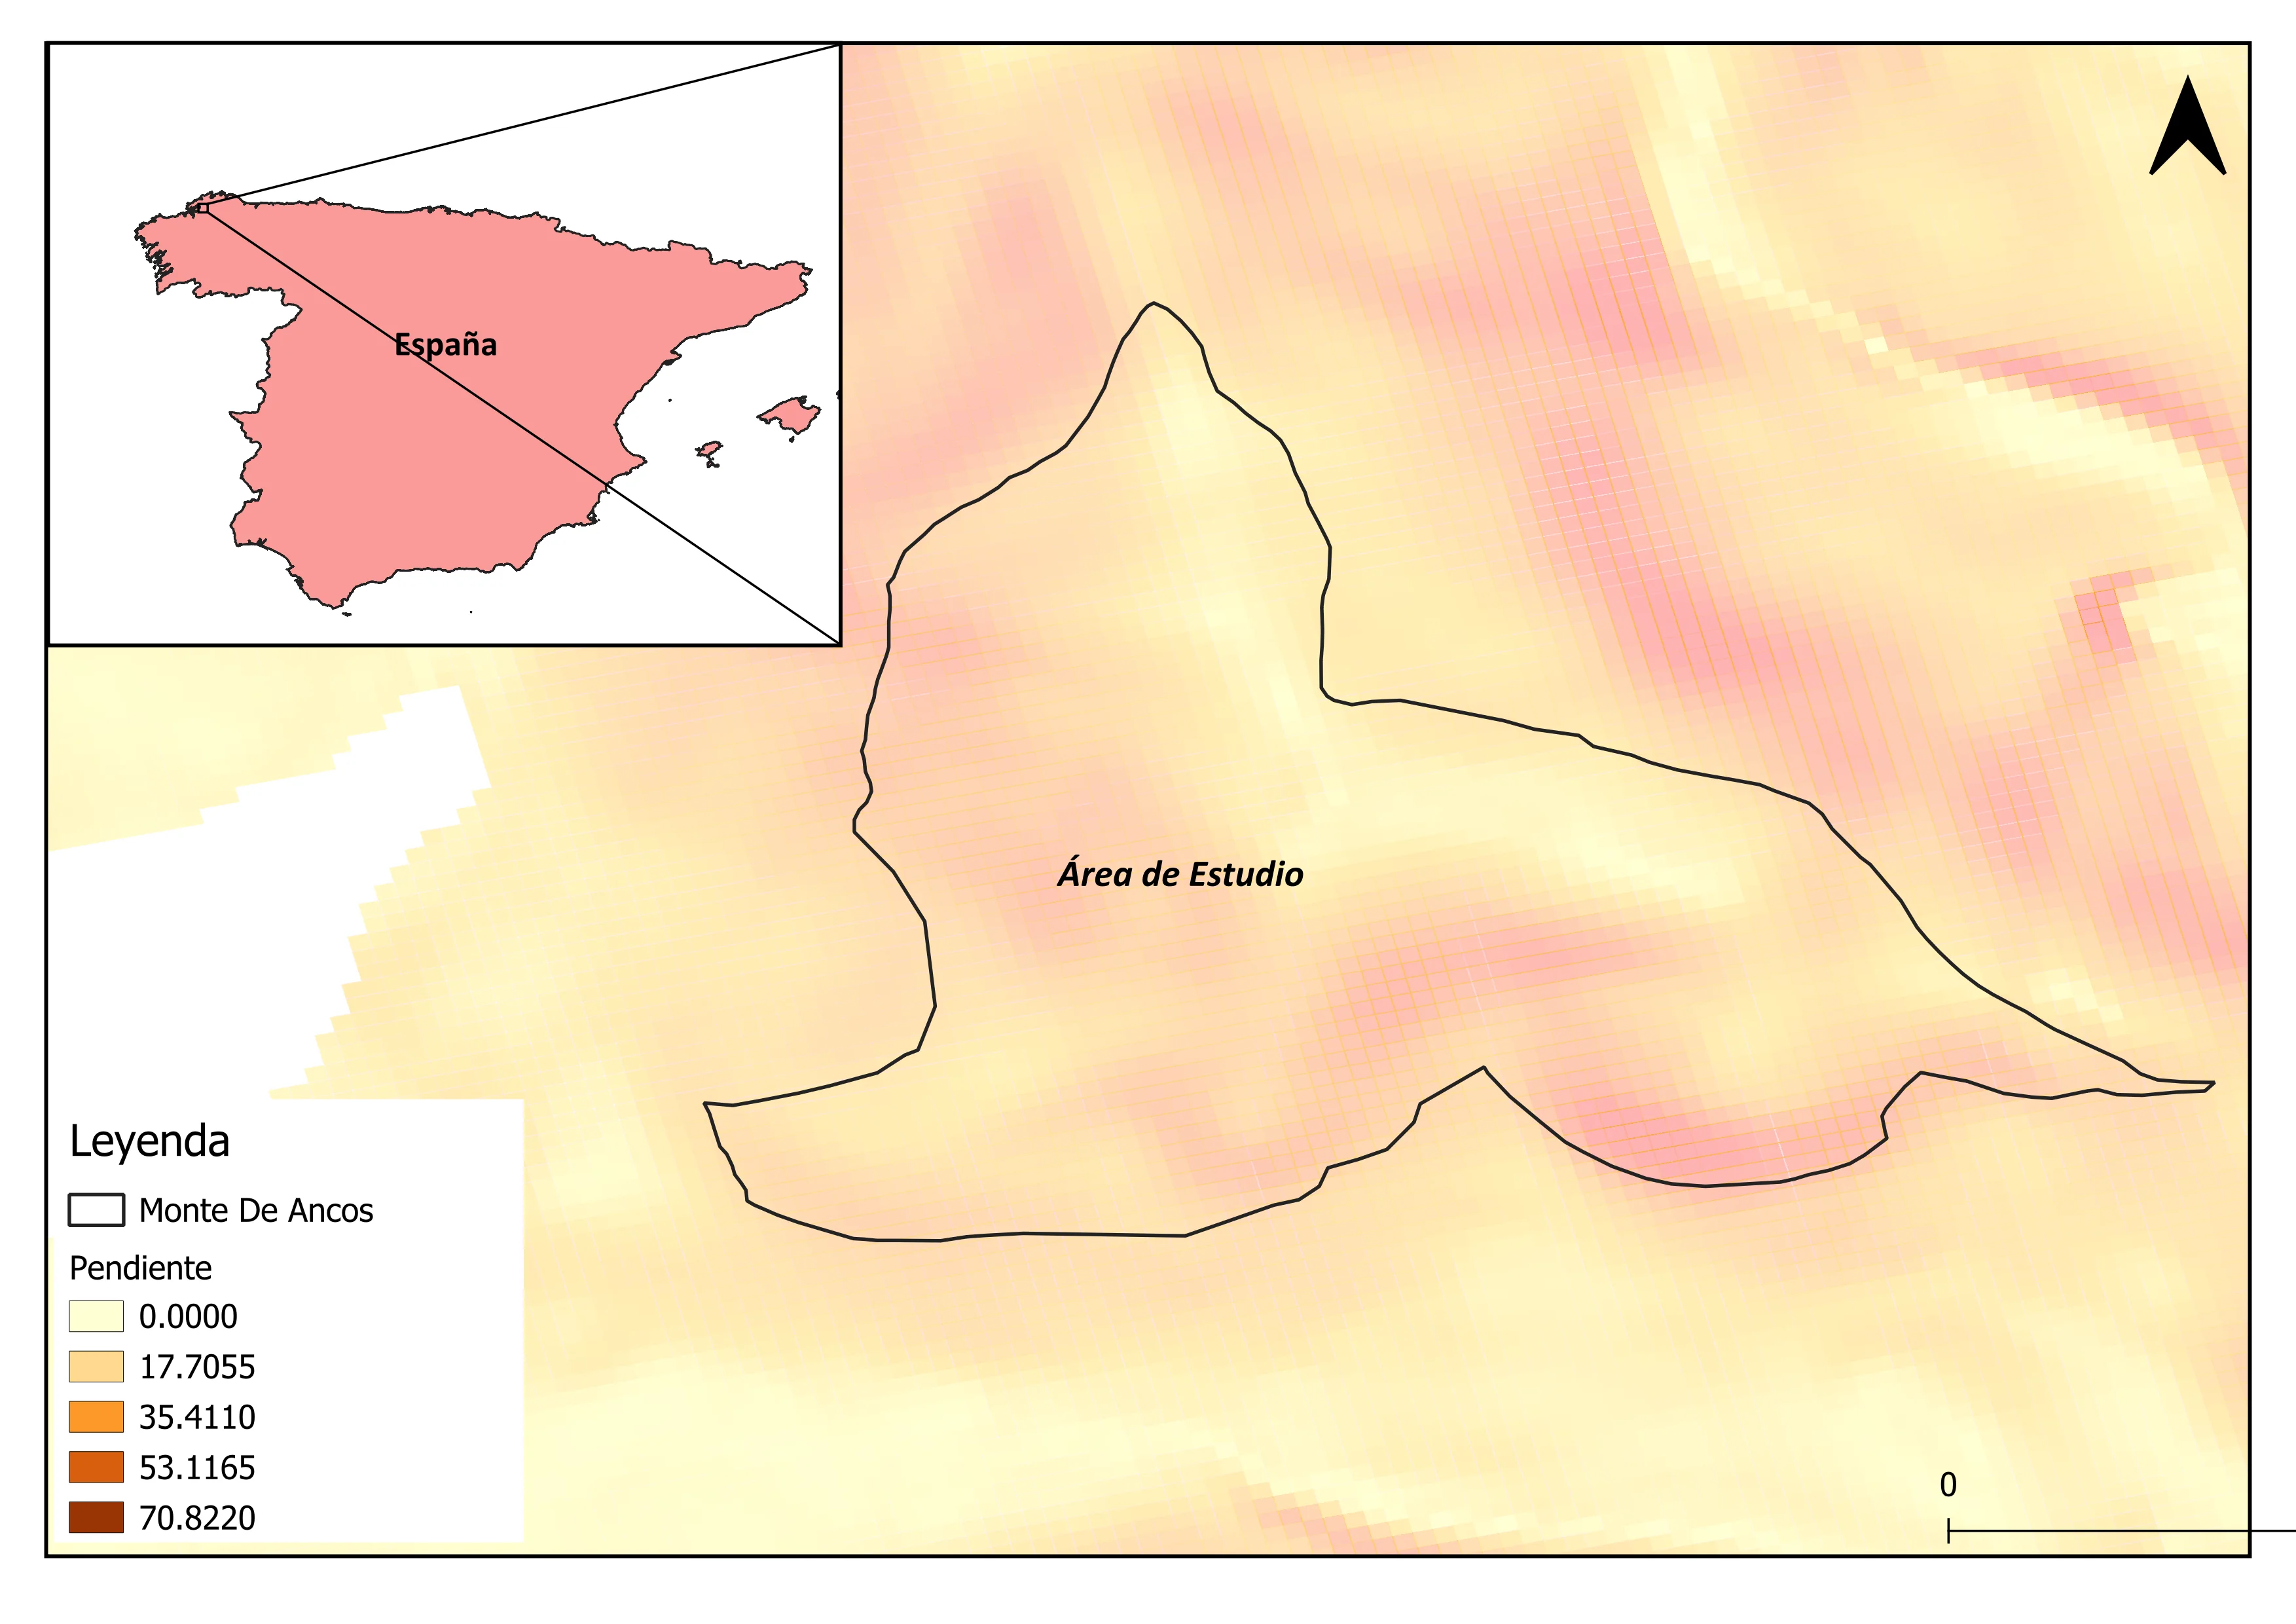
Hydrological Terrain & Slope Stability Evaluation
Multi-criteria terrain analysis deriving slope percentages, aspect, topographic wetness index (TWI), and flow accumulation to evaluate development stability and landslide susceptibility zones.
Spatial Analysis Deliverables
All analytical deliverables are accompanied by full mathematical summaries and reproducible scripts:
Frequently Asked Questions
Key statistical considerations for your spatial analysis projects.
IDW is a deterministic algorithm best suited when sampling density is high and values depend strictly on Euclidean proximity. Kriging is a geostatistical method that analyzes the spatial autocorrelation structure (semivariogram), accounting for directional trends and spatial clustering, and provides standard error prediction maps alongside the predicted surface.
A simple density heatmap merely reflects where points are concentrated, without considering attribute intensity or statistical significance. Getis-Ord Gi* compares the local sum of values for a feature and its neighbors against the sum of all features. It yields z-scores and p-values, verifying whether a cluster has a less than 1% probability of occurring by random chance.
We incorporate both exclusionary constraints (e.g., protected nature reserves, minimum setbacks from waterways, slope > 15%) and continuous evaluation factors (e.g., proximity to transmission lines, solar irradiance, road accessibility, land parcel cost). Weights are assigned via Analytic Hierarchy Process (AHP) pairwise comparison matrices.
Yes. Rather than relying on inaccurate circular 'as-the-crow-flies' buffers, we build routable network graphs from OpenStreetMap or municipal road centerlines, factoring in speed limits, one-way restrictions, and turn penalties to compute exact 5, 10, and 20-minute drive-time or walking isochrones.