
Defensible Ecological and Coastal Modeling for Resilience Planning
Environmental systems require specialized scientific understanding that generic mapping technicians lack. Led by a specialist with an honors background in Fisheries and Marine Sciences and academic research experience with University of Southampton initiatives, GeoPhoenix bridges ecological domain mechanics with spatial computing.
We quantify physical hazards along vulnerable coastlines through the USGS Coastal Vulnerability Index (CVI) framework—integrating regional coastal geomorphology, shoreline erosion/accretion rates, coastal slope, relative sea-level rise, mean significant wave height, and mean tidal range. For terrestrial water resources, we generate hydro-conditioned Digital Elevation Models (DEMs), delineating catchments, Strahler stream orders, and Height Above Nearest Drainage (HAND) flood-hazard surfaces.
Environmental Frameworks
- USGS Coastal Vulnerability Index (CVI) square-root formulation
- D8 & D-Infinity flow direction and accumulation algorithms
- Height Above Nearest Drainage (HAND) flood inundation modeling
- Marine Spatial Planning (MSP) & fishing effort gridded analysis
- Environmental Impact Assessment (EIA) sensitivity zoning
Environmental GIS Capabilities
From oceanographic dynamics to montane hydrological catchments.
Coastal Vulnerability (CVI)
Quantitative ranking of shoreline segments under sea-level rise scenarios, combining coastal slope, geomorphology, tidal amplitude, wave energy, and erosion trends.
Flood-Risk & Inundation Mapping
Rapid flood hazard zoning using HAND topography, hydrodynamic runoff accumulation, and digital surface models to model 10, 50, and 100-year flood extent zones.
Hydrological Watershed Delineation
Pit-filling, hydro-enforcement of culverts, D8 flow accumulation, pour point basin delineation, and automated extraction of Strahler stream hierarchies.
Marine Spatial Planning & Fisheries
Spatiotemporal modeling of fishing gear distribution, vessel monitoring system (VMS) tracking density, and marine protected area (MPA) boundary optimization.
Geological & Terrain Geomorphology
Lithological fault trace mapping, structural strike/dip alignment, hillshade relief visualization, and landslide slope risk categorization.
Vegetation Health & Carbon Stocks
Canopy structure metrics, Normalized Difference Vegetation Index (NDVI) anomaly tracking, and biomass proxy estimation for conservation credit validation.
Our Environmental Modeling Protocol
Adhering to defensible oceanographic and hydrological standards.
Geophysical Baseline Compilation
Acquiring calibrated bathymetric data, Copernicus DEMs (30m/12m), tidal station harmonic constituents, wave buoy time-series, and coastal geology maps.
Hydro-Conditioning & Preprocessing
Correcting DEM sink depressions, burning stream centerlines through artificial bridge barriers, and segmenting coastline reaches into uniform 100m–500m analysis transects.
Multi-Variable Risk Indexing
Classifying parameters into standard 1–5 risk rankings and computing compound index scores (e.g., CVI = sqrt((a*b*c*d*e*f)/6)) with sensitivity analysis.
Spatial Deliverables & Peer-Review Prep
Delivering georeferenced spatial vectors, classified hazard rasters, and methodology documentation suitable for regulatory compliance or scientific journal review.
Featured Environmental GIS Deliverables
Examine verified environmental projects executed by GeoPhoenix.
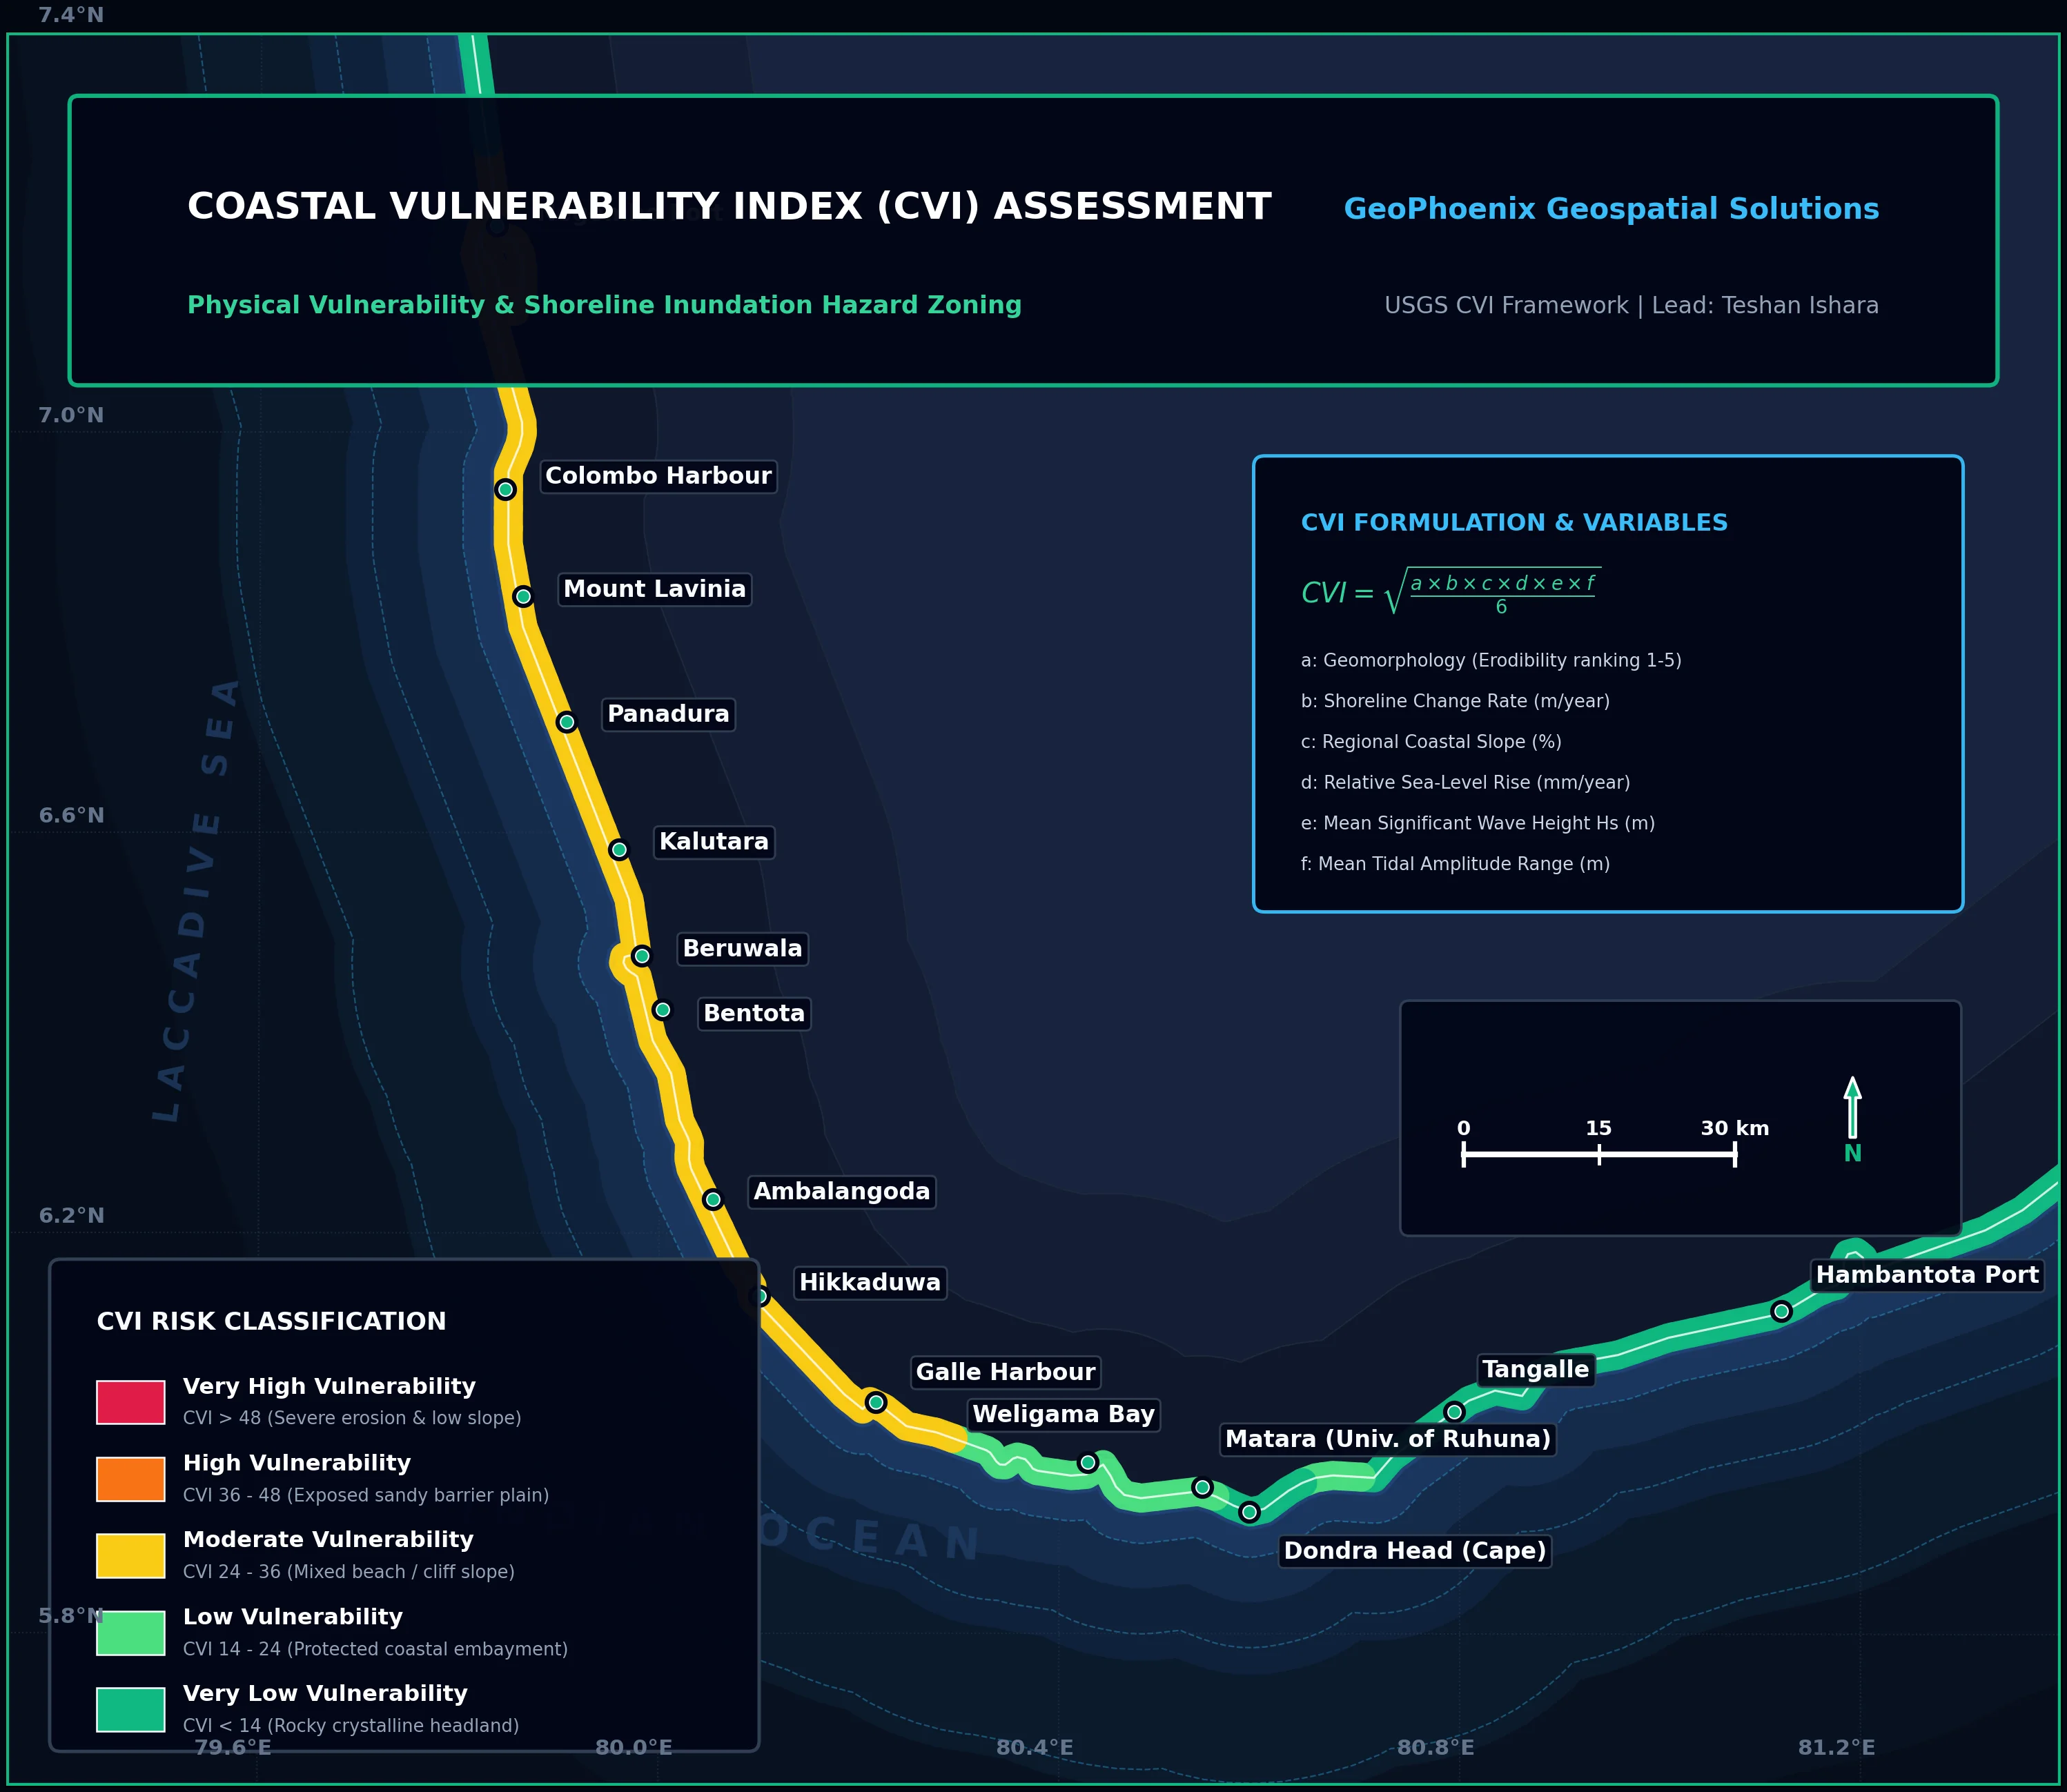
Coastal Vulnerability Index (CVI) Assessment
Comprehensive assessment of coastal reaches exposed to storm surge, sea-level rise, and long-term erosion. Ranked physical parameters into categorical vulnerability tiers with risk hot-spot delineations.
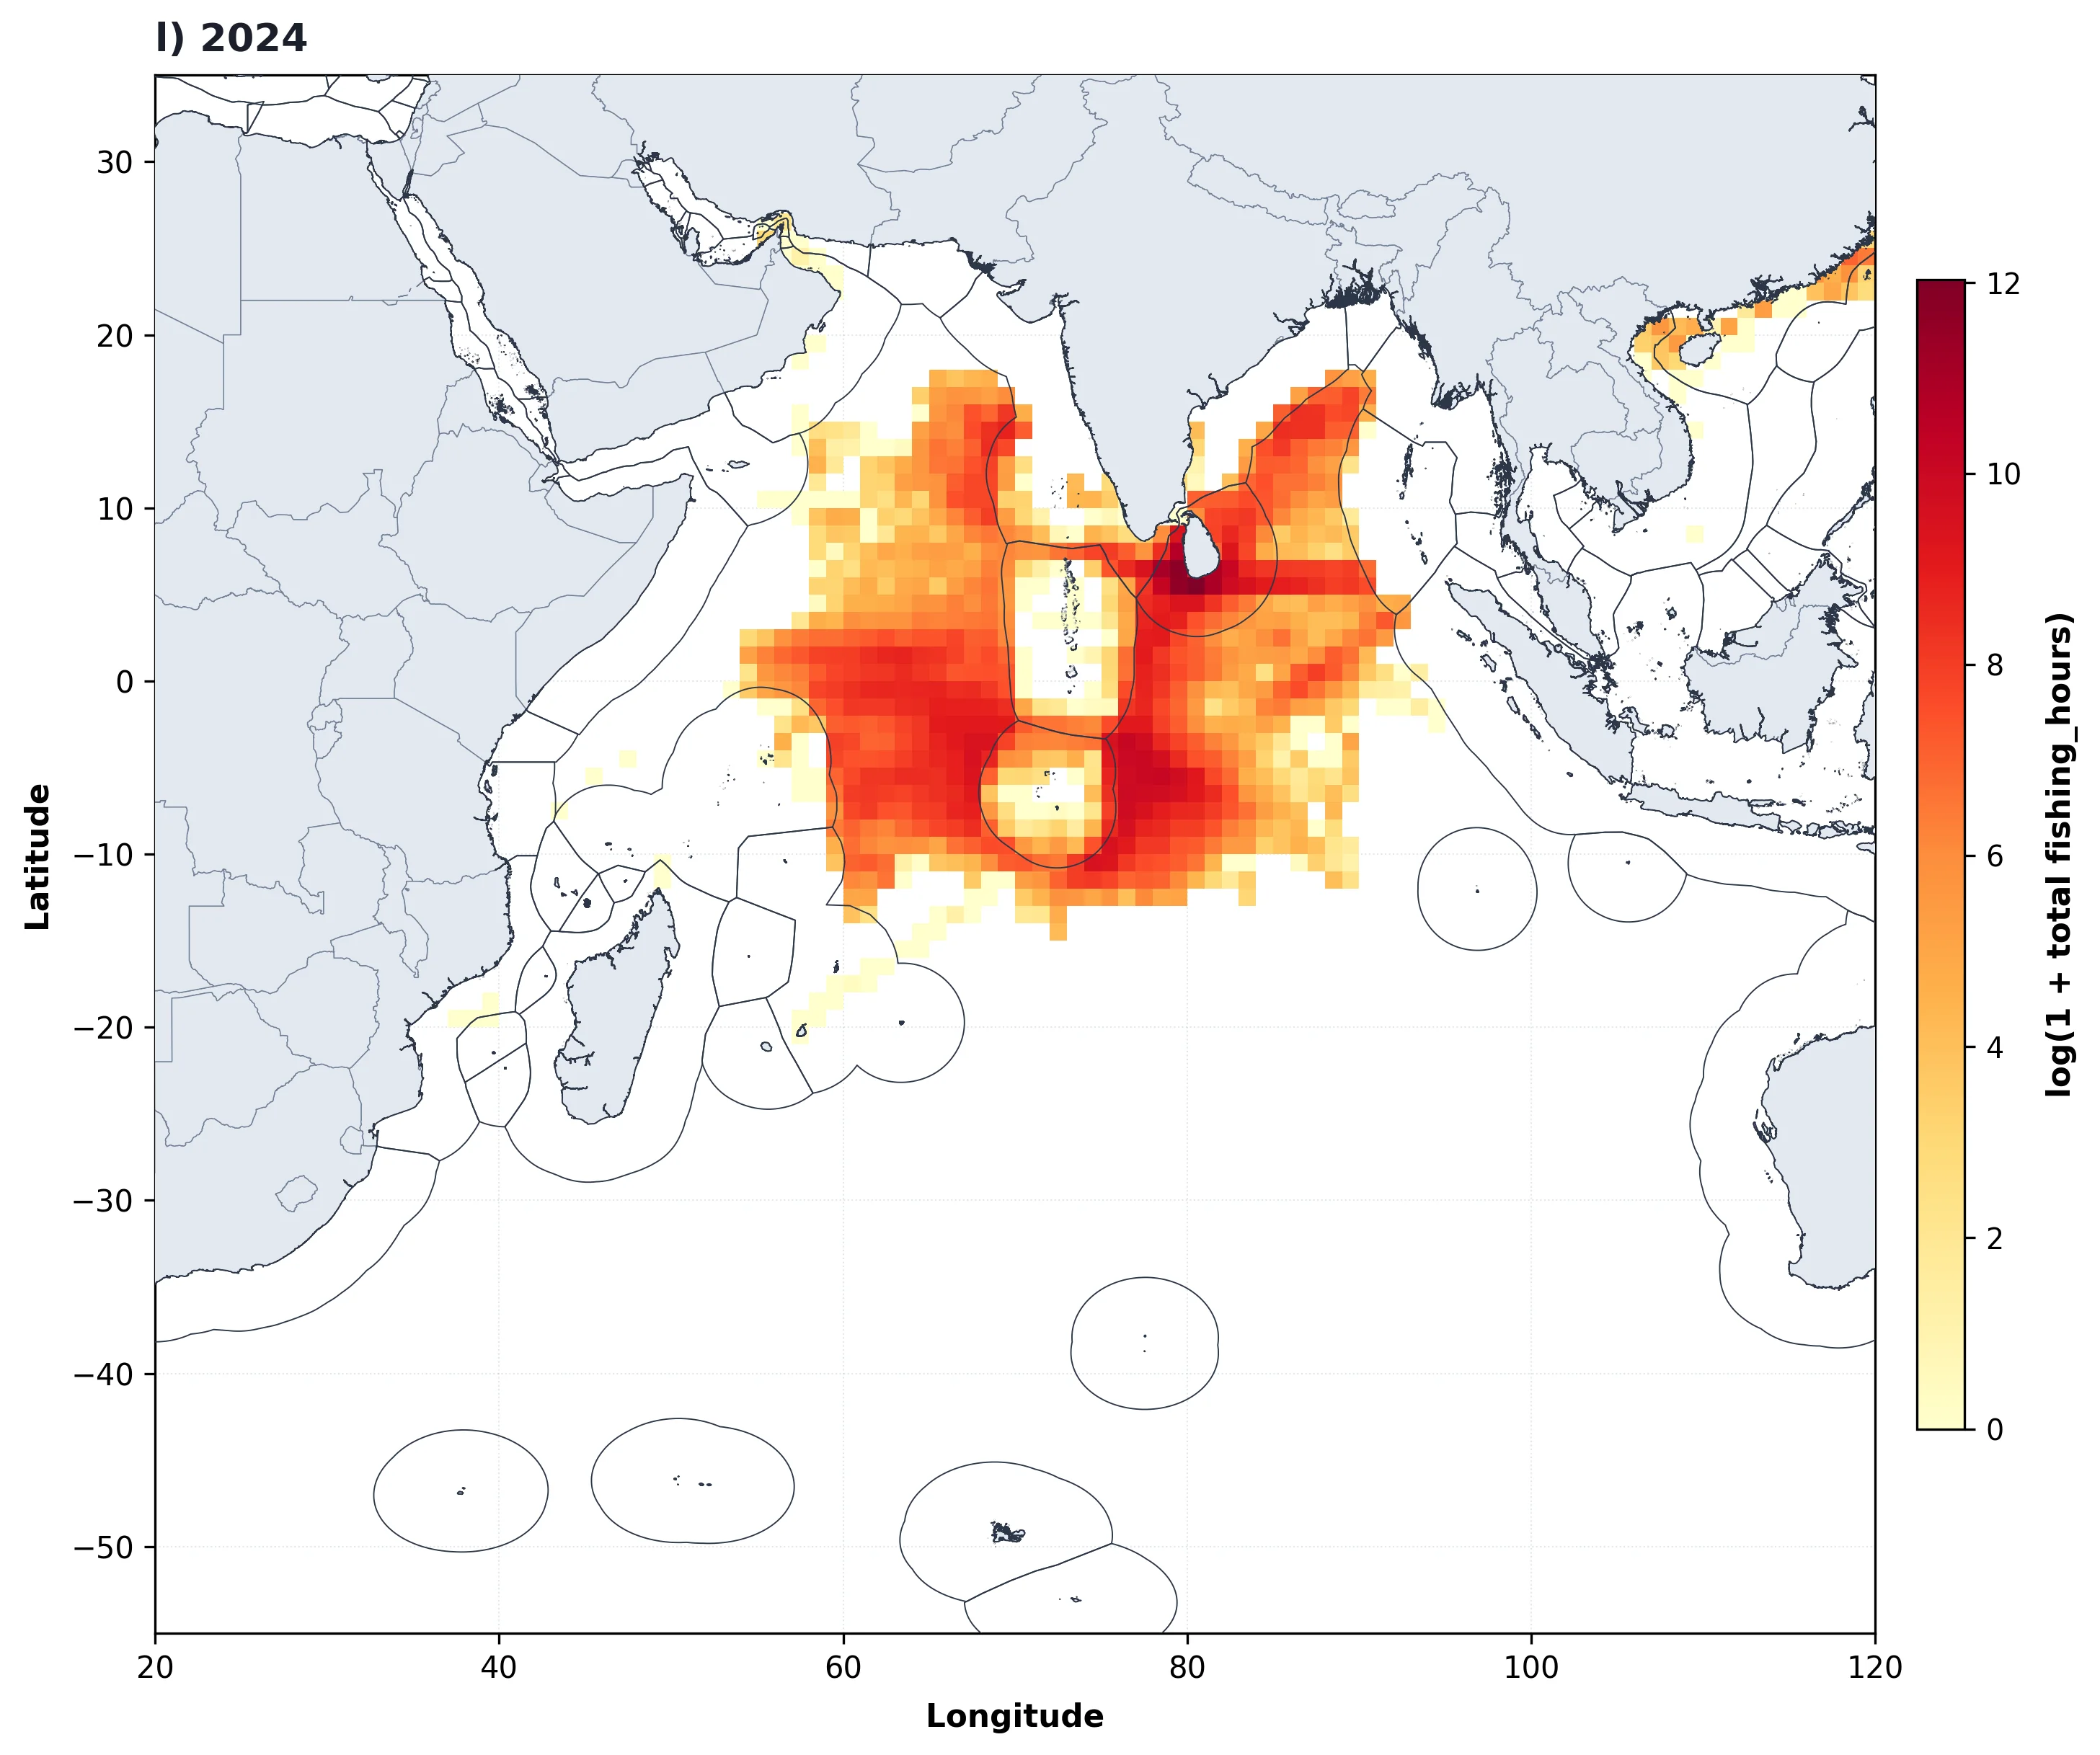
Marine Fisheries Effort & Spatial Analytics
Decadal tracking of marine fishing vessel effort (hours) aggregated across a 1-degree global grid in the Indian Ocean, revealing long-term gear diversification and seasonal patterns for sustainable marine management.
Environmental GIS Deliverable Packages
Scientifically defensible assets tailored for regulatory agencies and scientific journals:
Frequently Asked Questions
Key details regarding coastal and watershed modeling services.
We typically evaluate six key physical parameters: coastal geomorphology (erodibility), historical shoreline erosion/accretion rates (m/yr), regional coastal slope (%), rate of relative sea-level rise (mm/yr), mean significant wave height (m), and mean tidal range (m). Each parameter is normalized into 1–5 risk bins.
Unlike raw elevation, HAND normalizes topography relative to the local drainage network. Each cell's value represents its vertical distance above the hydrologically connected riverbed, allowing rapid, computationally efficient flood height stage simulations without running intensive 2D hydrodynamic numerical solvers across entire basins.
Yes. Combining marine biodiversity records, bathymetric contours, vessel density maps, and benthic substrate classifications, we utilize spatial systematic conservation planning tools (e.g. Marxan or spatial multi-criteria evaluation) to propose boundary configurations that minimize commercial conflict while maximizing ecological protection.
Yes. Delineated sub-basins, longest flow path lengths, average basin slopes, and curve number (CN) land-use soil overlays are structured to import directly into standard hydrologic modeling software such as HEC-HMS, HEC-RAS, and EPA SWMM.